Tendai

On anything that got to do with software development

Month: February 2018

Big Data Handled Using Apache Hadoop

Introduction

In the article, Big Data, what does it mean?,  I spoke about what Big Data is and its characteristics. Upon conclusion, we noticed that there are technologies that are used to handle Big Data and that one of those technologies is Hadoop. In this article we will look at what Hadoop is used and a high overview of how it is used to handle Big Data based on the research I did online and what I understood.

What is Hadoop?

In order to understand what Hadoop is, one needs to understand the problem Hadoop is trying to address, and that problem is Big Data. We now know that Big Data is characterized by the 3 Vs, volume, velocity and variety. There is need to store huge amounts of data, in its different forms, and that cannot be done on a single computer. There is also need to process that huge amount of data and again it cannot be handled by a single computer using the traditional software we already have.

Lets use a hypothetical scenario in order to understand what Hadoop is. There is a bumper harvest on a farm and there is need for storage of the harvest, say wheat. Now a single silo will not be able to store all the wheat and there is need for more than one silo, say 24 is needed. All the wheat is harvested and stored nicely in the silos. Now the wheat needs to be processed so that the farmer can produce flour for baking. To process one silo takes about, say 24 hours, that is one day. For all silos, that will take 24 days and the farmer’s clients are already waiting for the flour to be supplied and they cannot wait for 24 days. The farmer then employs a more advanced machinery that can process more wheat and takes less time, say for one silo it now takes 4 hrs. If my math is right, one machine will take 4 days to process all the silos, but this needs to be done in one day, so the farmer buys 3 more machines. All is good, the wheat is processed in a day and the following day all the flour has been packaged and is ready for delivery. All this is summarized below:
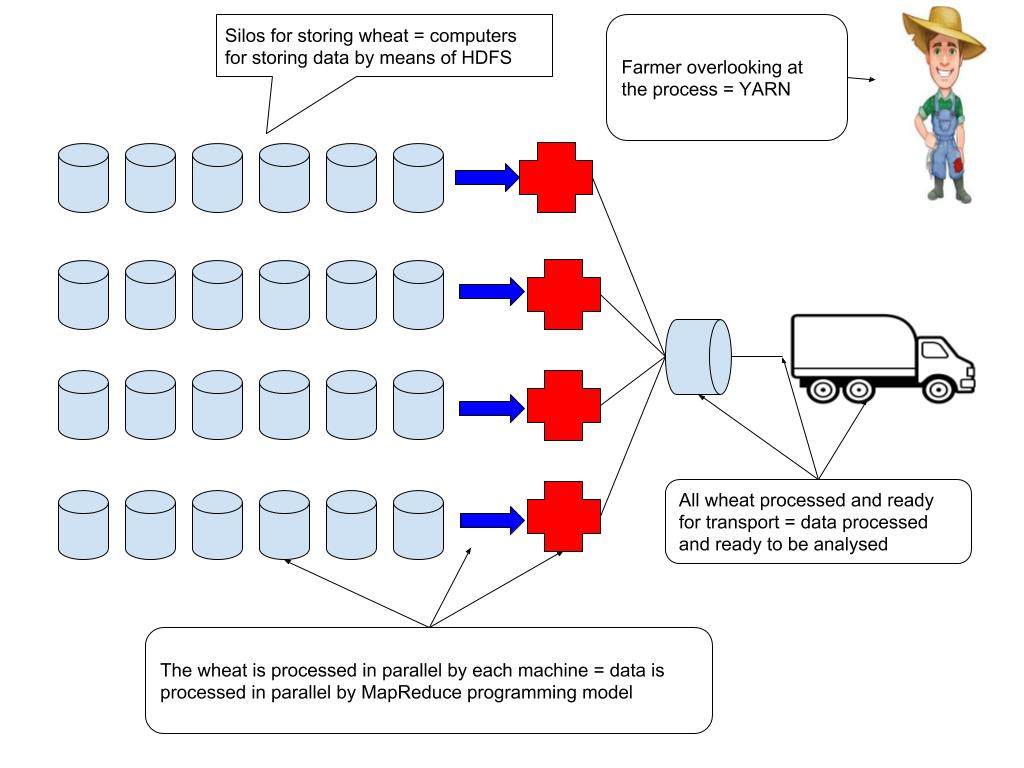
Wheat can be thought of as data that needs to be stored and one silo will not do. The same with data, one computer will not be sufficient and hence we need a number of computers. A collection of computers whose purpose is to store data and process it is known as a cluster and each computer on that cluster is known as a node. The wheat can be thought of as being distributed to each silo. This is the same with data, it is distributed among the computers and in Hadoop it is achieved using its distributed flies system known as Hadoop Distributed File System, HDFS in short. The wheat again is processed in parallel so that flour can be produced in a day. This is the same with data, it can be processed in parallel so that whatever computation is done can produce results faster. In Hadoop this is done using a MapReduce programming model. For the machines to operate smoothly, the farmer needs to overlook at the whole process and in Hadoop that is done using YARN short for Yet Another Resource Negotiator.

Hadoop, an Apache open-source project, is therefore a combination of modules whose purpose is to store and process huge amounts of data. At the core of Hadoop, there is HDFS, responsible for storing the data and MapReduce, responsible for processing the data. In addition to the core there is Hadoop YARN and Hadoop Common. The modules are summarized as follows:

Hadoop Distributed File System (HDFS) is a distributed file system that stores data on commodity machines, providing very high aggregate bandwidth across the cluster.

Hadoop MapReduce is an implementation of the MapReduce programming model for large scale data processing.

Hadoop YARN is a platform responsible for managing computing resources in a cluster and using them for scheduling applications.

Hadoop Common contains libraries and utilities needed by other Hadoop modules.

Back to our farm analogy, if the farmer wants to keep say chickens for poultry farming, the farmer will build a poultry cage on the very same land where wheat is grown and kept. The farmer can do more than one activity on the farm, the limit here is the size of land and talent. Same thing with Hadoop. It is not limited to the aforementioned modules, but other modules can be added onto the platform such as Hive, HBase, Zookeeper, Kafka, Storm, Spark and so forth. All these modules perform different functions.

How it began

The co-founders of Hadoop are Doug Cutting and Mike Cafarella. The name Hadoop, came from Doug’s son’s toy elephant.  Doug and Mike were inspired by the “Google File System” paper that was published in October 2003. The initial development was on the Apache Nutch project but later on moved to the new Hadoop project in January 2006. The first committer to add to the Hadoop project was Owen O’Malley in March 2006 and Hadoop 0.1.0 was released in April 2006. It continues to evolve through the many contributions that are being made to the project.

Conclusion

This was just a high overview of what Hadoop is and how it handles Big Data. From this, in short, we can say Hadoop is an aggregation of different modules wholes purpose is to store and process Big Data in an efficient and secure manner. In future articles, I will look into the core modules of Hadoop in depth.

Source:
Wiki Apache Hadoop

Big Data, what does it mean?

Introduction

The buzz these days is Big Data. From government institutions to private entities, they are all talking about Big Data. What is Big Data? In this article, I will try to explain what Big Data is based on the research and understanding I did.

Big Data, what is it?

Before answering this question, the first question we must ask ourselves is, what is data? Dictionary definition of data states that data is facts and statistics collected together for reference or analysis. If you think about it, we have been collecting data for a very long time before the dawn of computers, using files and books. Now with the use of computers we moved from capturing facts or statistics on paper to using spreadsheets and databases on computers. Once the information has been captured on computers it is now in binary digital form.

Now let us look at the definition of big. The dictionary defines big as something of considerable size or extent. Some words that are synonyms to big include, large, great, huge, immense, enormous and so forth. Combining the two, it follows that we can say Big Data is an enormous collection of facts and statistics collected together for reference or analysis. Is it that simple? Not even close. To understand why, we need a small history. Remember we shifted from paper to computers for capturing data and guess what, the first hard drive, which is a storage device on a computer for storing data, only captured 5 MB of data. This is equivalent to Shakespeare’s complete work or a 30 second video clip of broadcast quality.

Today, a standard computer can have a hard drive that can hold up to 15.36 terabytes (TB) of data. If 10 terabytes of data is equivalent to the printed collection of the U.S Library of Congress, 15.36 terabytes, now that’s a lot of data on a single computer. I am sure we can start to see why Big Data is in hype these days. In terms of volume, we can now have the capability of holding as much information as we can using computers. But is that all? I mean is Big Data about the amount of data we can hold? Not even close.

We are no longer capturing data using computers only, we now have smart devices such as our phones,  refrigerators,  airplanes and even motor vehicles. All these devices have the capability of capturing data. Now imagine people on a platform like Twitter and they are tweeting about something that has just happened using their phones and people at work are also on the same band wagon, posting about the same thing. Now all of a sudden there is a lot of information coming through Twitter and say for every two seconds, a hundred people are tweeting. At this point, Twitter is not only experiencing a surge of data but the speed or velocity that the data is coming through is also high. People are not only posting using text but they are also using pictures and videos. Now not only surge and speed but data is also coming in different varieties.

At this point we can see that Big Data is not only about the volume of data but it is also about velocity and variety. In Big Data world, these characteristics are known as the 3 Vs. Lets look at the each of the Vs.

Volume

Volume is one of the main characteristics of Big Data because of the meaning of the word volume itself, which means, the amount of space that a substance or object occupies or that is enclosed within a container. In this case we can rephrase it to the amount of data that is occupied on a hard drive. For instance, think about the fact that Twitter has more active users than South Africa has people. Each of those users have posted a whole lot of photographs, tweets and videos. What about platforms such as Instagram, they have reported that on an average day 80 million photos are shared and what about Facebook, it is reported that it stores about 250 billion images.

Lets try to quantify this data. Say you have a phone that has a resolution of 1440 x 2560 pixels, multiply 1440 by 2560 which gives you 3,686,400 pixels. You then multiply this number by the number of bytes per pixel:
16 bit per pixel image: 3,686,400 X 2 bytes per pixel = 7372800 bytes = 7.37 MB approx
32 bit per pixel image: 3,686,400 X 4 bytes per pixel = 14745600 bytes = 14.75 MB approx

Now for argument’s sake, if on average day 80 million photos are shared on Instagram, how much space is need if say all users as using a phone with the above resolution? If my Maths is right, that is about 1,180,000,000 MB which is 1.18 Petabyte, take note here, per DAY!! Now, that’s a lot of hardware equipment that is need to store that much of information.

Velocity

Velocity is also an important characteristic of Big Data. Why? Again, from the meaning of the word velocity, which is, the speed of something in a given direction. In this case, the speed at which data is flowing to a data center. Back to our Twitter analogy, every second, on average, around 6,000 tweets are tweeted, which corresponds to over 350,000 tweets sent per minute, 500 million tweets per day and around 200 billion tweets per year. That is a lot of information that needs to be handled so that there are no bottlenecks. If a user logs on Twitter, the experience must be flawless.

Variety 

Variety is the quality or state of being different or diverse; the absence of uniformity or monotony. In others words, not the same and this is true for data as well. From the examples we used, people tweet using text, photos and videos. The data here is different. In other words data can be structured and unstructured,  which means that not all data can easily fit into fields on a spreadsheet or a database application. There got to be ways and means of storing data in its different form.

Conclusion 

Big Data is not only how huge or enormous the data is but its also about how fast the data is moving and its type. If there is a surge in the amount of data that needs to processed, the next question we need to answer is, how is it all handled? When a user logs on Twitter, Facebook, Instagram or on a news site like BBC or streaming on YouTube, the experience is flawless, but the amount that is coming through those platforms is huge and moving fast and in different form. Due to this, it gave birth to various technologies that are being used to manage the surge.  These technologies include, Hadoop, Spark, Hive, Kubernetes just to mention a few. Will look into some of these technologies in future articles.

Source
How much is data
First hard drive
Twitter stats
Images measure

My experience with Scala – Part 1

Introduction:
This is going to be a series of theories and personal experience with Scala.  I am currently using Scala for developing Spark applications.

Background:
Scala is an abbreviation of the term SCAlable LAnguage. It was created by Professor Martin Odersky and his group at EPFL, Ecole polytechnique federale de Lausanne, Switzerland, in 2003. Scala provides a high-performance, concurrent-ready environment for functional programming and object-oriented programming on the Java Virtual Machine (JVM) platform.

Installing Scala:
As a JVM language, Scala requires the use of a Java runtime. Scala 2.11 needs at least Java 6. For optimal performance, rather install Java 8 JDK. The download for Java 8 JDK is available on Oracle’s website.

The following installation can be done on Ubuntu. Copy and create an executable file and run it. For instance, using nano or any editor of your choice, from the terminal:
sudo nano install_java_scala.sh  -> this will create a file called install_java_scala.sh
copy the script below and paste
ctl + o + enter to save
ctl + x to exit nano
sudo chmod +x install_java_scala.sh to make the file executable
run ./install_java_scala.sh

Notes:
We are installing wget in order to download the installation files needed to install Java and Scala.
Also not that you might have to change the link to download Java, because it changes.

Script:
install_java_scala

Once it is done, you can test to see if both Java and Scala have been installed correctly. To test, from the terminal run java -version and you should get:

java version “1.8.0_161”
Java(TM) SE Runtime Environment (build 1.8.0_161-b12)
Java HotSpot(TM) 64-Bit Server VM (build 25.161-b12, mixed mode)

As for Scala, just run scala and you should get:

After running scala from the terminal, you will be now on the Scala REPL and all is good to go for coding in Scala. If you are having issues in getting started with Scala, make sure that the Java command is installed correctly and that the system path points to the correct Java version.

The Scala REPL is a tool for evaluating expressions in Scala: for instance, type println(“Welcome to scala!”), it will print, Welcome to Scala!. The scala command will execute a source script, like the above println(text), by wrapping it in a template and then compiling and executing the resulting program. A help system is available and can be started by entering :help command.

Note: A Read-Eval-Print Loop (REPL), also known as an interactive top level or language shell, is a simple, interactive computer programming environment that takes single user inputs (i.e single expressions), evaluates them and returns the result to the user.

The other tool to install is SBT, which is the de facto build tool for Scala and the instructions for installing the tool can be found here (scala-sbt.org). Once the installation is done, you will be able to run sbt command from the terminal. If you start the sbt command and don’t specify a task to run, SBT starts the REPL. Below is the lists of sbt tasks you can run together with the description of the task:

      • clean      Delete all build artifacts
      • compile  Incrementally compile
      • console  Start the Scala REPL
      • eclipse   Generate Eclipse project files
      • exit        Quit the REPL or Ctrl+d
      • help       Describe commands
      • run         Run one of the “main” routines in the project
      • show x   Show the definition of variable “x”
      • tasks      Show the most commonly-used available tasks
      • tasks -V Show ALL the available tasks
      • test        Incrementally compile the code and run the tests
      • ~test      Run incr. compiles and tests whenever files are saved
        This works for any command prefixed by “~”


Conclusion

This is a basic introduction to Scala. In the next series I will look into useful terms in Scala that needs to be defined and explained.

Source:
Learning scala
REPL 
REPL 2


© 2025 Tendai

Theme by Tendai BepeteUp ↑